 Nick Wienholt, a Sydney-based consultant specialising in quantitative and data engineering, provides an introduction into big data, machine learning and artificial intelligence, along with practical examples on how to take advantage of these new data sets.
The impact of technological change in investment and funds management is as profound today as the initial digitisation of trading markets around the world in the 1960s and 1970s. Everyone is aware that lots of stuff is happening, but how each of the buzz terms maps to concrete outcomes and what is driving all the crazy noise is poorly understood. This is partly because the concepts are not well integrated into a coherent picture by technologists and also because drivers of change are coming for many different domains, not limited to technology alone.
What is artificial intelligence?
The most fundamental question to address is why machine learning and AI is suddenly so hot. Many of the machine learning and AI concepts that are currently exploding in popularity and applicability have been around for decades, but it took many factors to coalesce before the technology became mainstream. The diagram below shows the authors take on how these factors led to today’s AI ‘summer’:
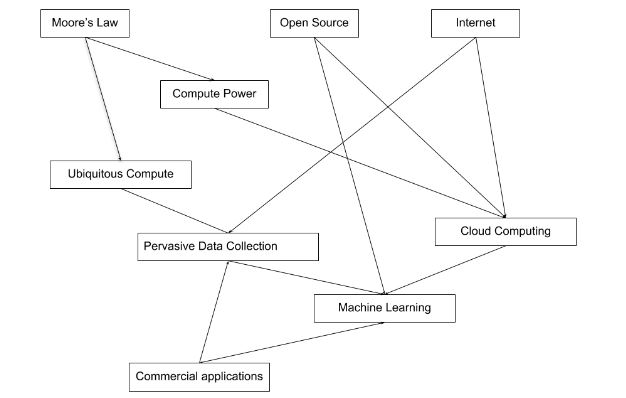
Moore’s Law, which in a very coarse sense predicts that processing power will double every 18 months, has continued to provide incredible compute ability both in traditional computers and, in the last decade, mobile devices. As can be seen in the diagram, this cheap, powerful data processing ability has unlocked an incredible amount of subsequent developments.
The combination of the internet and cheap computers to enable cloud computing has been revolutionary in terms of both the data that can be collected, and the insights that can be delivered by analysing this data. This has reignited machine learning and AI research which had largely stagnated for two decades.
Despite the lofty titles, machine learning and AI is very simple at its core – think of the temperature of the room you are in now – a number of elements determine the current temperature. Potential factors include:
Whether an air-conditioner is switched on
The temperate the air-conditioner is set to
The outside temperature
The material the room is made of
The size and number of any doors and windows
The number of people in the room
So if all these room temperature ‘inputs’ are known, how can the temperature of the room be determined?
While various heat exchange models could be developed to determine temperature from physical principles, an alternate approach is to simply observe a lot of different rooms with known inputs and a known temperature, and work out how much each input should be weighed.
Computers are really good at crunching the maths to work out the optimum value for weighing each input to arrive at the most correct output for all the observations, and that is all machine learning is.
The computer DOESN’T learn how to think – all it does is produce a bunch of weights (also known as parameters) that can be applied to observations to predict the end outcome.
This maths, which is known as regression, can be extended to classification, anomaly detection, recommender systems and classification problems.
Stepping outside the direct realm of machine learning, mass digitisation has led to much more efficiency in large, standardised financial markets. This in turn has resulted in capital seeking more novel approaches to investment decisions, and advances in machine learning and cloud computing have come into play.
The last major thematic worth considering is ubiquitous computing. Enabled by the same advances in electronics that powers Moore’s law, we now have computers everywhere. The most iconic example is the super computer in your pocket that also comes with a superb camera and a highly accurate location sensor. Coupled with the Internet of Things and more mundane technology like radio-frequency identification(RFID), Bluetooth and near-field communication (NFC), data about stuff is being thrown off at an insanely fast rate.
So all the players are here now:
Super-fast computers available on demand as a commodity resource
Algorithms and data packages that can auto-magically glean insight from huge, raw datasets like never before
Data being thrown off in an incidental fashion by many moving things on the planet
Super-big data centres co-located with the super-fast computers to store the data
Business drivers to find insights into this data with the computers and algorithms on offer
Given all this goodness, why are so many industry participants still scratching their heads and wondering where to start? Two major inhibitors exist:
The people that know how to operate the compute and data management at scale (the software engineers) don’t know the maths and data science folks who can deliver the insights; and these two groups don’t like the other strange suit-wearing people that want the market insights captured and executed on. A ‘three-tool’ player who can intelligently converse with all three groups is hard to find
Wide-scale data availability is still limited, and the data that is available is often dirty, difficult to map to other data sets, and limited in temporal scope to the last few years
The people problem is amenable to a somewhat brute-force solution. Problems of significant enough financial or social importance can offer consultants and employees commensurate rewards. In a very crude sense, the rewards on the table (both financial and non-financial) can be increased until talent of sufficient quality is procured.
Getting the data is hard. Compliance, operations and security will all make accessing internal datasets a lengthy journey, and external datasets are even harder to get. Data from vendors has the problem that (by definition) it is more widely diffused, and more ‘creative’ ways to procure data risk the legal and reputation consequences that Cambridge Analytica experienced.
A hypothetical journey into ‘new’ data
To illustrate a path forward, the fictional equity analyst named ‘Xenia’ and her journey from Excel into this new world will be examined. Xenia is great at her current job – she knows a lot about balance sheets, cash flows, net present value and once even bought a few Berkshire Class B shares with plans to visit Omaha.
Xenia also sees a growing gap between her Excel skills and all this ‘new stuff’.
Xenia spends a lot of time talking and thinking financial theories, and has watched so much financial TV that she no longer reflexively categorises Tom Piotrowski’s beard into various genres of hobo-chic. She has many intuitions about leading indicators for financial companies, but doesn’t have the data to prove them.
One day she has an insight that high staff turnover seems to be a leading indicator of financial problems, and angry staff indicates a company with very big problems. She knows she can’t just ring around the head office of ASX200 companies and get their staff churn figures (and even better their staff engagement indexes), so she needs a proxy for this data that is publically available.
Amazingly, such a proxy exists via LinkedIn. She picks a few prominent ASX laggards that have hit hard times, and confirms staff were leaving these companies before the ASX announcements, trading suspensions and capital raising made the problems obvious to all market participants. Glassdoor was an even richer source of information for Xenia’s analysis, and staff anger became much more pronounced and publicly proclaimed as companies’ prospects turned south.
Incredibly, Xenia realised the Python programming skills that two semesters of introductory courses in Uni had gifted her was perfect for hitting the web Application Programming Interfaces (APIs) that both Glassdoor and LinkedIn provided. As a mid-level analyst, she was able to quickly develop a rough-and-ready ‘Staff Happiness Index’ of the ASX20 that involved a bit of programming and a lot of data patching.
The process being followed was remarkably simple – market intuition combined with representative or proxy data to form a rough prototype of a new data indicator. No supercomputers were needed, and the statistics to normalise staff turnover for industry grouping and company size was easily available in orthodox financial records.
The hunt for data proxies is one of the more interesting aspects of the challenge. Other data proxy examples include:
Using the satellite imagery of the shadow of oil tank storage roofs (which move up and down according to storage volume) to create a comprehensive near real-time map of oil reserves
Imagery of car parking lots to discern shopping trends for retailers
A huge array of government datasets available in both Australia and internationally, many of which can be used to assess retail-exposed companies
The question of how to industrialise Xenia’s ‘Staff Happiness’ Index is where the work of data scientists and engineers becomes required. The matching of ASX tickers to the Glassdoor and LinkedIn employer names is messy and tedious, and refreshing the dataset to capture better trend data wasn’t trivial. Xenia now needed a software engineer to help productise this tool and some form of operational capacity to keep the data and calculations ticking along.
Obviously this fictional account is highly idealised – bring all these components together is hard (but far from impossible); interesting ideas often die a death of neglect in the face of real world responsibilities; and the time investment for a simple prototype can easily drift into the hundreds of hours.
With this background of why this new stuff really counts and how toes can be dipped in the machine learning and new data universe complete, we’ll look at some more advanced scenarios in future articles.
About the author
Nick Wienholt is a consulting quantitative and data engineer based in Sydney. With a focus on the sport betting and financial markets, he enjoys helping clients not just with the conceptualisation of data solutions but also completing the much harder work of developing and productionising data pipelines that can generate meaningful market insights. Past clients include Kindred Group, Commsec and various proprietary trading firms. Nick is happy to discuss how data engineering and machine learning can improve your trading outcomes, and can be contacted at quant.click.